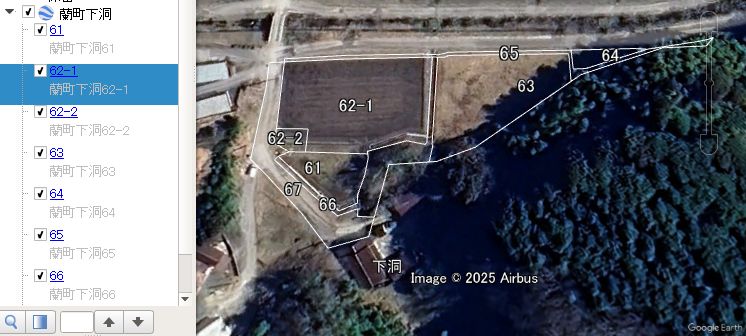
地籍図を閲覧するときには
筆界とともに地番も必要です。
Google Earth上で筆界とともに地番を表示させるためには
地番表示用のポイントを別途作成し、
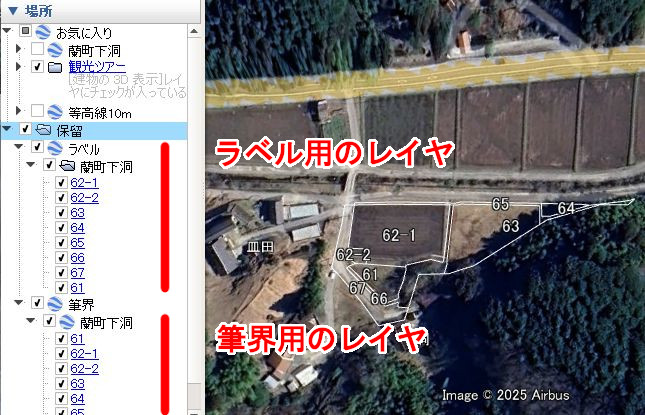
- 筆界と別レイヤで管理する
- またはマルチジオメトリにより筆界と統合し、同じレイヤで管理する
1番目の方法は、簡単に作成できますが、レイヤが2つできるので、レイヤ欄が見にくくなります。
2番目の方法は、レイヤが1つにまとまるので見やすいですが、作り方が複雑です。
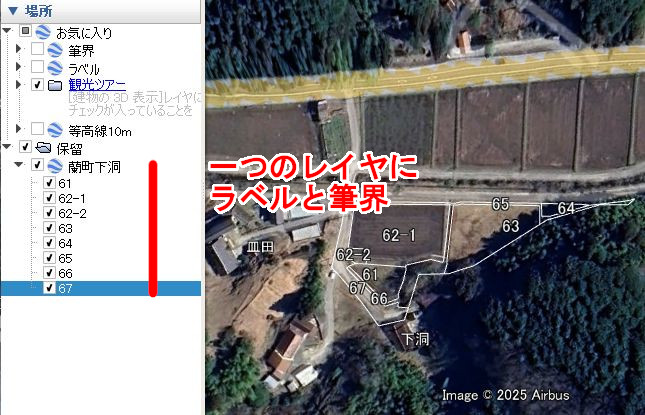
ここでは2番目の方法を説明します。ポイントとポリゴンを統合するにはマルチジオメトリという要素を使います。
これを作るために、pythonではgeopandasとsimplekmlを使います。
まずは筆界の中に、ラベル用のポイントをgeopandasにより作成します。
1
2
3
4
5
6
7
8
|
import geopandas as gpd

fj = open(ファイル名, "r", encoding="utf-8")
gdf = gpd.read_file(fj)
fj.close()

# 筆界内部に点を作成
gdf['point_on_surface'] = gdf.representative_point()
|
このラベル用のポイントを筆界と統合するために
simplekmlを使ってマルチジオメトリを作成します
 1
 2
 3
 4
 5
 6
 7
 8
 9
10
|
import simplekml
kml = simplekml.Kml()

multigeom = kml.newmultigeometry()

# ポリゴンをつくる
multigeom.newpolygon(outerboundaryis=["外側の座標"], innerboundaryis=["ドーナツポリゴンのときの穴の部分の座標"])

# ラベルとなる位置をポイントとして設定する
multigeom.newpoint(coords=["ラベルを表示するXY座標"])
|
上のコードを利用して、
公図のXMLをgeojsonに変換したのち、一括してマルチジオメトリを作成するには
以下のとおり
  1
  2
  3
  4
  5
  6
  7
  8
  9
 10
 11
 12
 13
 14
 15
 16
 17
 18
 19
 20
 21
 22
 23
 24
 25
 26
 27
 28
 29
 30
 31
 32
 33
 34
 35
 36
 37
 38
 39
 40
 41
 42
 43
 44
 45
 46
 47
 48
 49
 50
 51
 52
 53
 54
 55
 56
 57
 58
 59
 60
 61
 62
 63
 64
 65
 66
 67
 68
 69
 70
 71
 72
 73
 74
 75
 76
 77
 78
 79
 80
 81
 82
 83
 84
 85
 86
 87
 88
 89
 90
 91
 92
 93
 94
 95
 96
 97
 98
 99
100
101
102
103
|
# 公図のgeojsonをKMLのマルチジオメトリに変換する
# simplekmlとshapely, geopandasが必要
# 2025年1月11日

import os
import glob

import simplekml
import shapely
import pandas as pd
import geopandas as gpd

# kmlスタイルの作成
sharedstyle = simplekml.Style()
# ポイントのスタイル設定
sharedstyle.iconstyle.icon.href = ""
# ポリゴンのスタイル設定
sharedstyle.polystyle.fill = 0

# 公図のgeojsonの読み込み
## ファイルパス
path_locate = r'Z:\home\'
file_list = glob.glob(os.path.join(path_locate,"*.geojson"))

## ファイル数の探索
number_files = len(file_list)
exec_file_number = 1

# 空のデータフレームをつくる
all_data = gpd.GeoDataFrame()

## 一括読み込み
for file in file_list:
    ### 進捗状況
    print(f'{number_files}個中{exec_file_number}個目のファイル{os.path.basename(file)}を処理中')
    exec_file_number += 1

    ### 読み込み
    fj = open(file, "r", encoding="utf-8")
    gdf = gpd.read_file(fj)
    fj.close()

    # すべてのデータを結合
    all_data = pd.concat([all_data,gdf])

# 並び替え
all_data.sort_values(['大字名','丁目名', '小字名', '地番'], inplace=True)

# ラベルとなる、ポリゴン内の点を作成。
all_data['point_on_surface'] = all_data.representative_point()


# 字ごとにkmlファイルをつくる
## 初期設定
prev_town_name = ''


for feature in all_data.iterfeatures():
    # 各フィーチャの属性を取得
    street_number = feature['properties']['地番']
    town_name = str(feature['properties']['大字名']) + str(feature['properties']['丁目名']) + str(feature['properties']['小字名'])
    town_name = town_name.replace("None","")
    pos = feature['properties']['point_on_surface']

    for i in feature['geometry']['coordinates']:
        number_polygons = len(list(i))
        inner_boudary = []

        # geojsonのgeometryは、最初のリストが外側の境界、それ以降のリストは内側の境界なので、分けて処理する
        for k in range(0, number_polygons,1):
            # 外側の境界を取得。これはすべてのポリゴン
            if k == 0:
                outer_boundary = list(i[0])
            # 内側の境界がある場合はこれを取得
            elif k > 0:
                inner_boudary.append(list(i[k]))

    # 字ごとにkmlファイルを作成
    if prev_town_name != town_name:
        # kmlをつくる
        kml = simplekml.Kml()
        kml.document.name = town_name

        prev_town_name = town_name

    # ポリゴンをつくる
    multigeom = kml.newmultigeometry(name=street_number)
    multigeom.newpolygon(name=street_number, outerboundaryis=outer_boundary, innerboundaryis=inner_boudary)

    # ラベルとなるポイントをつくる
    multigeom.newpoint(coords=[(shapely.get_x(pos), shapely.get_y(pos))])

    # 図形をクリックしたときに住所を表示させる
    multigeom.description = town_name + str(street_number)

    # スタイルは共通のものをつかう
    multigeom.style = sharedstyle

    # ファイル出力 フィーチャーごとに作成してしまっているので、改良の余地あり
    wf = os.path.join(path_locate, town_name + ".kml")
    kml.save(wf)

    ~~~
|